


DATA ANALYSIS: How NYC Officials Fudge the Numbers on Crime
DATA ANALYSIS: How NYC Officials Fudge the Numbers on Crime
+ Where You're Most Likely to be a Victim of Violent Crime in NYC


The best lies always have a kernel of truth in them.
While subway crime showed a slight downturn in 2023 as compared with 2022, to say that “crime is down” intentionally obscures the real story. Simply zooming out on the timeline paints a far different picture than what elected officials claim.
The NYPD Transit Chief Michael Kemper told PIX11 News last week that 1.8% of crime in New York City happens within the subway system.
Insisting that there will be more cops on the subway, Kemper reassured that public safety is a priority.
PIX11 asked about the perception that subways aren’t safe. Here’s what Kemper said:
“Here’s the facts: 1.8% of all crime in the city occurs in the subway system. And that’s the problem, because you tell people that and they’re taken aback. And that goes to perception and fear.
Perception and fear is real to so many people, and that’s our challenge. It’s what they see in the news. Incidents like this don’t help, but they are rare. They are not indicative of what goes on everyday in the subway system.”
The comments come amid a push from Mayor Eric Adams to prove that crime is down, following final 2023 crime numbers.
If this narrative were true, why would they have to push it so hard? New Yorkers are smart. We’ve seen sensational crime news for years. Whether on the cover of the New York Post, local TV news, and now social media, we’re no strangers to saturated coverage. And yet, there is a rising perception that crime is up. Are they really trying to tell us it’s just in our heads?
The first problem with the 1.8% figure is that it doesn’t take into account the fact that New Yorkers don’t spend all their time on the subway. In fact, that figure is closer to 1.4%, as noted by Sam Antar in his insightful blog post.
The next problem is that 1.8% largely measures a static figure. In recent history, subway crime has generally stayed around that number. It tells you almost nothing about the change within the subway over time.
This is especially troubling coming from the NYPD Transit Chief, whose main concern should be tracking how subway crime changes year-over-year, spotting trends, and figuring out what to do about it. So why would he use this figure? The only reason to use the 1.8% figure is to try to cover up what’s really going on.
As we will see in this data analysis, murder, felony assault, and rape (three of the four major violent crime categories) are all UP in the subway as compared with both 2019 and 2008. Further, these increases on the subway were worse than the citywide increases.
Murder
Let’s start with murder/non-negligent homicide. NYPD’s CompStat is a great tool to break down numbers, but it doesn’t provide specific location descriptions, at least not on public-facing data.
(Note: the NYC OpenData tool shows much more granular data, including location type for most incidents. OpenData vs. CompStat figures differ a bit. CompStat is updated more frequently, so that should be preferred for accuracy. For our purposes, we will use a combination of the two — but in direct percent-change comparisons, the same system is used. Both tools pull from NYPD data.)
For 2023, there were 361 murders listed (CompStat: 386), with 179 marked “null.” Checking the provided coordinates, these seem to be at random locations, including post offices. Based on the forthcoming data for other crimes, it seems like much of “null” is on the street or at locations that fall outside of the definite categories, aka “other.” The majority of the null data is also designated as “outside,” in another column. We will consider null as “Street/Other.”
147 murders occurred at either a multi-dwelling apartment, multi-dwelling public housing, or a private house. Though there are times where residences, especially multi-dwelling buildings, can be pseudo-public for visitors, we won’t consider them public for our purposes.

That leaves 214 murders in public/pseudo-public locations. Of these, 4, or 1.87%, occurred on the subway. You might say that the subway is relatively safe then. But, you could also say that the grocery/bodega is relatively safe at 13, or 6%. A bar or nightclub is even safer, at 7, or 3.3%. But is this the right way to assess risk?
Getting on the subway in the South Bronx at 3 a.m. is certainly not safer than going to a grocery in Northeast Queens at 3 p.m. Not by a mile.
If I were concerned about probability for murder, or any given violent crime in New York City, there are far better factors to measure like time of day and geographic location.
If I live in the city and commute daily — or if I were responsible for safety on the subway — I’d probably care more about how these figures change year by year. And, I would compare these to other location categories like bodegas or bars.
Let’s go back to 2019 to look at the comparable chart.

By the same process as above, we come to 172 murders in public spaces. Of these, 3, or 1.74% were on the subway.
Murder is tricky because, it’s the most rare out of all violent crime, so we have a smaller dataset we can analyze. As we get granular, working with single digits to determine trends is not ideal.
And, they’re not the best metric to define crime, because the murder rate can decline year over year while overall crime can rise, as we experienced recently. As Manhattan Institute Senior Fellow Rafael Mangual said on The Daily Show:
“In NYC, about 5% of street segments see about 50% of all crime. About 3.5% see about 50% of all violent crime.”
So, if we say “murder is down,” it could mean it’s down on just a few of NYC’s most dangerous blocks — whereas citywide, overall violent crime could still be up.
Regardless, we could say that murder on the subway is up 33% because it went from 3 to 4 since 2019 — or up 100% compared with 2008’s count of 2 — which is true, but this is somewhat misleading on its own.
To get a better picture, let’s look deeper and chart out murders on the subway since 2008.

All of a sudden, the single-digit changes demonstrate a trend. To be more even-handed, let’s look at averages.
On average, in the 10 years preceding 2020, there were 1.6 murders per year on the subway. Over 2020 - 2023, the average is 7, a 337.5% increase.
You might say it’s unfair to compare an average of 10 years to an average of only 4 years. But, even if we hypothetically had zero subway murders for the next six years, the average would still be 2.8, which would still represent a 75% increase.
Citywide, murders are up 21% since 2019, and down 26% since 2008. But, looking at averages, the mean murder count was 373 in the decade preceding 2020. It’s 445 over 2020 - 2023, a 19% increase. We would need to reach 325 murders or below each year for the next six years just to get back to the average of 373.
By pretty much any lens you want to use, murder rates actually became substantially worse in the subway than they did citywide.
But, suppose we took the completely unacceptable high of 10 murders in 2022; that comprised “only” 2.3% of the year’s 438 citywide murders.
This is how you hide behind numbers.
A New York Times article notes that the 2022 figure of 10 is in stark contrast to the average of two per year “before the pandemic began.” I would argue that more importantly than the pandemic, which likely has an indirect effect on violent crime, I think it’s more important to define the “pre-” era as “before bail reform/progressive-backed police defunding,” which is unfortunately smudged together with the former, both happening in 2020.
Murder is often used as a barometer for violent crime overall. While it is a key metric, it represents a small fraction of overall violent crime. For a full picture, let’s look at the other three violent crime categories: Felony Assault, Robbery, and Rape.
Felony Assault
These are Felony Assaults in public spaces in 2023:

(Note: From a total of 27,496 assaults [CompStat: 27,849] we have removed 13,396 that occurred in residences from this analysis, for the same reasons above. The homeless shelter [771] category has also been removed from the chart, since it’s not really a public space. For convenience, the “null” category [originally 1,285], has been collated with the “other” [originally 499]. The “Misc.” category are locations like “liquor store” or “church” automatically grouped together by the Datawrapper tool after selecting to show 20 slices, out of 72 total location categories.)
We see that more than half of assaults happen on the street. Makes sense. The next highest individual category is the subway at 545 assaults. Not far behind are bodegas, parks/playgrounds, and bars/night clubs.
How does this compare with figures in 2019, the year before bail reform and other progressive “reforms” were enacted?
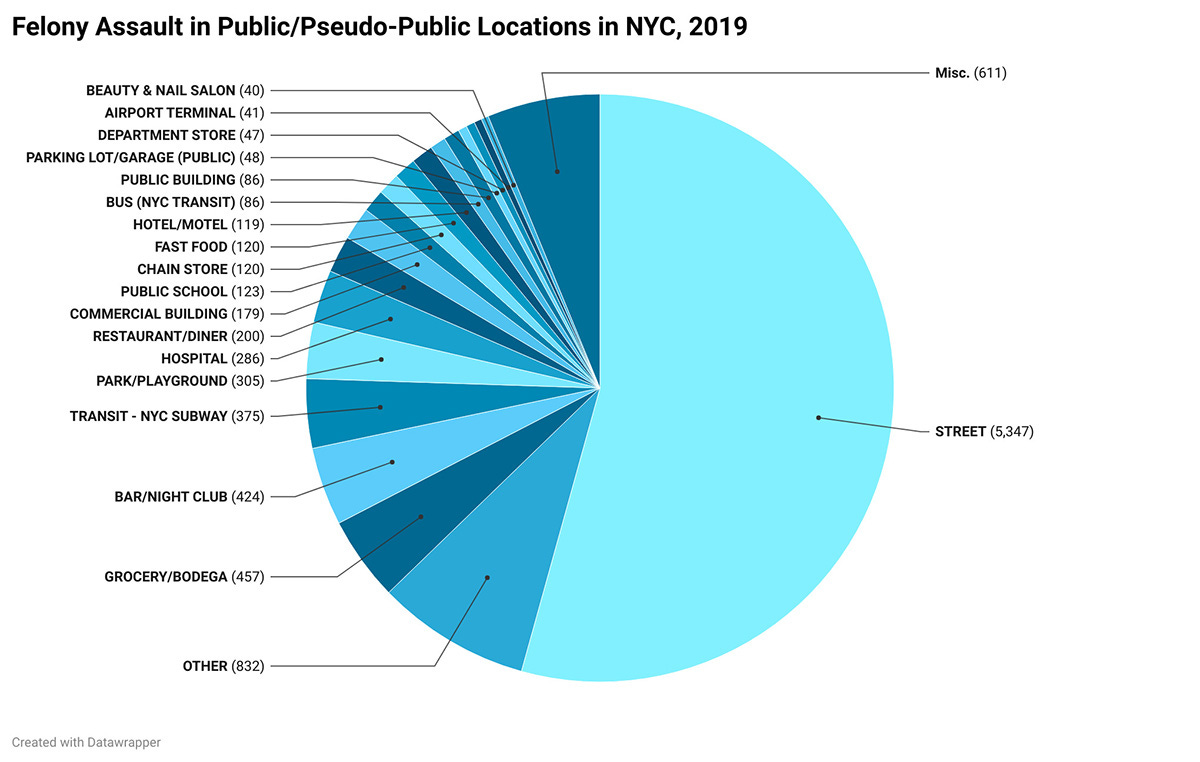
Citywide, there were 20,854 felony assaults in 2019, marking a 32% increase as compared with 2023. On the subway, there were 375 assaults, increasing since then by 45%.
This means that not only did we suffer a huge uptick in assault, but the rise was worse on the subway in particular. Compare this with bodegas which saw an 11% increase. Assaults at nightclubs/bars actually went down by 12.5%.

Since 2008, felony assaults on the subway have shot up from 183 to 545 in 2023, a 197.814% increase. Overall in the city, that figure was 16,284 in 2008 and ballooned to 27,849 in 2023, a 71% increase. The subway fares even worse here.
Yet, in 2023, felony assaults on the subway made up “only” 2% of all felony assaults citywide. But is that reassuring looking at the chart?
Robbery
Using similar methodology as above, compared with 2019, robberies went up citywide in 2023 from 13,434 to 16,865, marking a 25% increase.

Meanwhile, robberies on the subway remained nearly the same, going from 545 to 530, a 2.75% dip. This marks one out of the four violent crime categories where the subway performed better than the city overall.
Groceries and bodegas saw a whopping 76.6% spike, going from 457 to 807.

On the subway, robbery showed a significant decrease from 2008 to present day, going from 808 to 530 by 2023, a 34% reduction.

Citywide, robbery was at 22,401 in 2008, dropping to 16,902 in 2023, a 24% reduction, so the subway outpaced the city here as well.
Rape
The majority of rapes occur in private locations. Regardless, overall rape in the city luckily dropped in 2023 to 1,102 from 2019’s 1,574, marking a 30% reduction.

But, the subway did not follow this trend, jumping up from 3 in 2019 to 5 in 2023, which amounts to a 66% increase.

Stepping back, rape overall in the city rose from 1,299 in 2008 to 1,455 in 2023, a 12% increase.

On the subway, the graph is more scattered than the murder chart, but represents a 150% increase since 2008. Like with murder, this is not an ideal comparison because of single digit inputs.
Again, a better analysis might look at averages, with the average number of subway rapes being 3.6 over the decade before 2020. The average in 2020 - 2023 was 7.75. This represents a 115% increase.
So for this category, while citywide rapes decreased since 2019, but remained up since 2008 — subway rapes were up both short- and long-term, in both count and average.
Conclusion
The best objective measure for crime in NYC isn’t comparing to last year, nor is it comparing to the tragic highs we experienced in the 70s, 80s, and 90s, but to compare to what we know we are capable of achieving.
In 2018, NYC won an award for being the safest big city in the world, 2019 was also fairly safe because the results of dangerous and misguided “reforms” had not set in yet. Anyone with half a brain remembers how safe the city was during those years, so this is where the bar should be set.
We need to compare at least several years, which include key developments in NYC criminal justice policy, like 2020’s dramatic bail reform, NYPD defunding, and the ideological infection of District Attorney and judicial offices.
Did coronavirus have an impact? Of course, but it was indirect. And as the years go by, its overstated effects on crime are wearing off. It is far more instructive to look at the policy sea change.
Comparing 2019 to 2023, there is no category of violent crime that improved on the subway, unless you really want to count a 2.75% decrease in robbery. Factoring in post-2020 ridership levels, it’s either stagnant or actually an increase.
Worse, murder, assaults, and rapes are up on the subway, and at rates worse than the city overall.
Using the figure of 1.8% of crime happening on the subway is deceptive. It ignores the fact that New Yorkers don’t spend much of their overall time on the subway. The data show that any given publicly frequented location will similarly show small figures, except the street, where the majority of public crimes occur.
The better metric is change over time. By that lens, the city has gone backwards, marking the beginning of a major reversal of the previous trend of decline through 2019.
Critics of this kind of analysis usually say something like “this is nothing compared to the 80s” or dismiss it as fear-mongering. This is a shameful bending over backwards to defend progressive policy.
They willful disregard the fact that the incredible decline in crime after the 90s was no accident. It was the result of methodical, proactive policing with strong support from the criminal justice system. This isn’t disputed by any serious authority. New York City is legendary for its turnaround, and it was replicated in other cities to great effect.
With this in mind, why do progressives decide it’s okay to not only interrupt, but stop this downward trend?
If you enjoy LBRTY Digital and our mission of guiding New York toward a new era of prosperity and freedom, consider joining our inner circle of supporters with a paid subscription. For just the cost of a couple coffees a month, you’ll help establish LD as a powerful alternative to the mainstream NY media landscape.
Great read